
Original research · 5,000 member profiles · Ages 18 to 60
Sex and relationships by age: the Saucy Dates report
How do declared sexual interests and relationship preferences differ across age groups? This Saucy Dates report examines 5,000 randomly selected male and female member profiles, comparing adults aged 18 to 60 across 13 topics, from friendship and committed relationships to casual dating and sexual interests.
Explore all 13 original charts below, with refreshed explanations of what they show and what they cannot establish. The research is a historical snapshot of profiles on one dating service. It describes declared interests, not how often people have sex or how an individual’s preferences change over time.
5,000 profiles
The original report describes a randomly chosen set of male and female profiles from the Saucy Dates database.
Ages 18 to 60
The charts compare age groups at one point in time. They do not follow the same members as they grow older.
13 topics
Relationship goals and sexual interests are considered separately, with male and female chart series retained.
Where the data came from
The source was information members chose to display on their Saucy Dates profiles. At the time of the original report, the site described its membership as approximately 1.2 million, mostly from the US, UK, Australia and Canada. That is historical context, not the sample size or a current membership claim.
The published sample comprised 5,000 randomly selected male and female profiles. Random selection within a dating site database does not make the sample representative of the whole population. The original article does not publish collection dates, counts within each age group, gender totals, confidence intervals or a downloadable table of the chart values.
How to read the charts
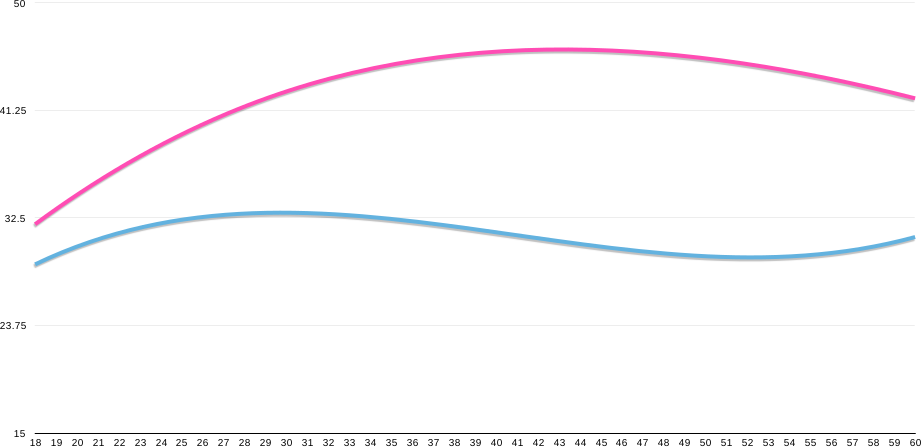
- Blue represents male profiles; pink represents female profiles. These are the categories used in the original report, not a complete account of gender diversity.
- The vertical measure is declared interest. It does not show verified behaviour, frequency or willingness to participate with a particular person.
- Compare groups, not personal life histories. A rising line with age does not prove someone becomes more interested as they get older.
- Profile disclosure can affect results. People may leave interests unstated for privacy or other reasons. The size and direction of any disclosure bias are not measured here.
- Differences are descriptive. Without subgroup sizes and uncertainty estimates, the charts cannot establish statistically significant differences.
All original chart files are preserved. The text has been updated for clarity; the findings have not been relabelled as a new survey.
Affairs: interest by age
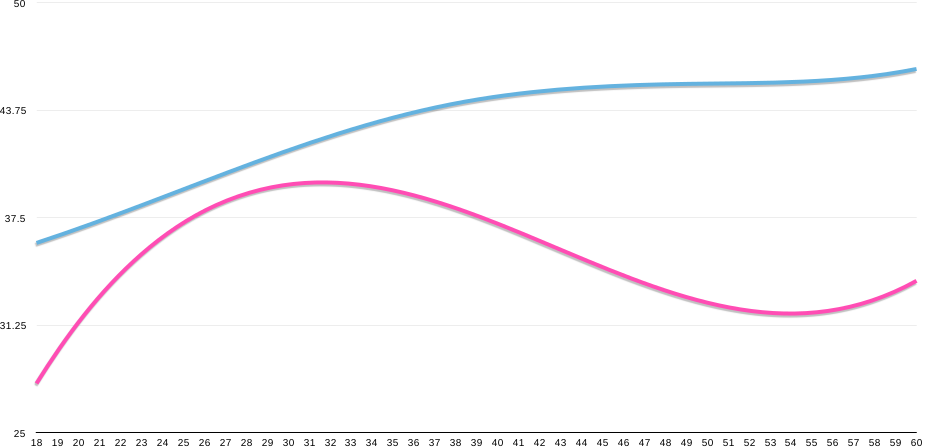
This category combined members interested in having an affair with members willing to become involved with someone having one. It did not establish anyone’s relationship status or record an actual affair.
What the chart shows
The original chart shows higher declared interest among men, with interest increasing across the male age groups. The female pattern is more variable, with a peak around the early thirties.
How to interpret it
Interest on a profile is not evidence of infidelity. These results cannot tell you whether an older partner is less trustworthy or why a particular age group selected the option. For a different question about relationship boundaries, see our survey on cheating and forgiveness.
Casual relationships: interest by age
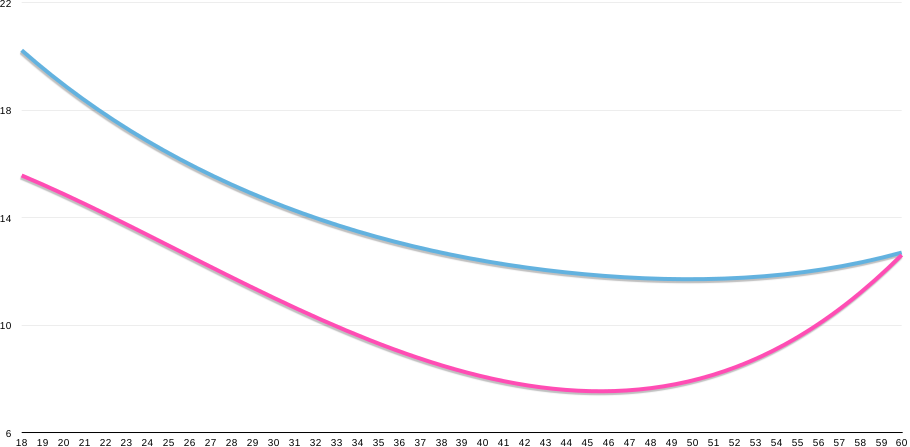
The report used casual relationship to mean a connection without an expectation of a committed partnership. This could include a single encounter or an ongoing arrangement.
What the chart shows
Declared interest generally declines across age groups for both men and women. Men show higher interest than women of a similar age in the published chart. Female interest rises again between 50 and 60; younger adults, particularly those aged 18 to 25, show strong interest.
How to interpret it
This measures stated interest, not how often anyone has casual sex. The chart does not establish gender ratios across the dating industry or anyone’s likelihood of finding a partner. Clear expectations matter at every age.
Serious relationships: interest by age
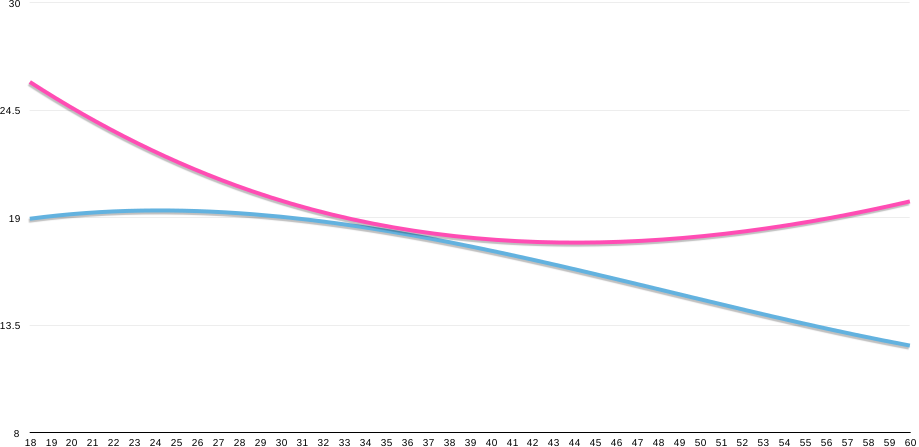
A serious relationship was defined broadly as a committed partnership, including a boyfriend or girlfriend relationship or one that might lead to marriage.
What the chart shows
Women show higher declared interest than men in the original chart. Interest is strongest among younger members and generally falls across older groups, with a later recovery among women. The original commentary identified the mid thirties as a point where the two series were relatively close.
How to interpret it
These are profiles on a casual dating service, not a survey of everyone seeking commitment. The chart cannot set a best age for a relationship, family planning or choosing a partner. Someone may also be open to more than one relationship type.
Group sex: interest by age
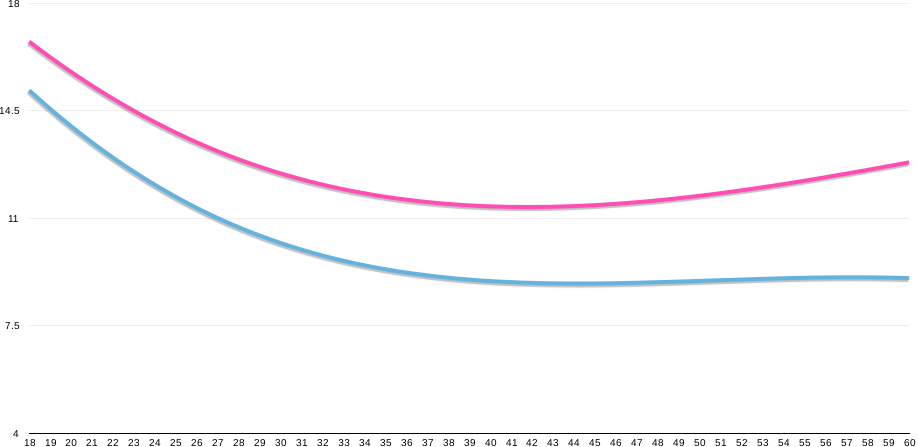
This category covered interest in sexual encounters involving three or more consenting adults, including arrangements involving couples.
What the chart shows
The published chart shows greater declared interest among women than men. Female interest is lowest around age 40, while male interest is comparatively consistent above 40.
How to interpret it
The data does not identify the combinations of partners respondents wanted, their relationship status or whether they ever acted on the interest. Avoid turning an interest category into assumptions about a person’s availability.
Friendship: interest by age
Friendship meant interest in chatting, exchanging messages or meeting without sexual activity. It could involve people of the same or a different gender.
What the chart shows
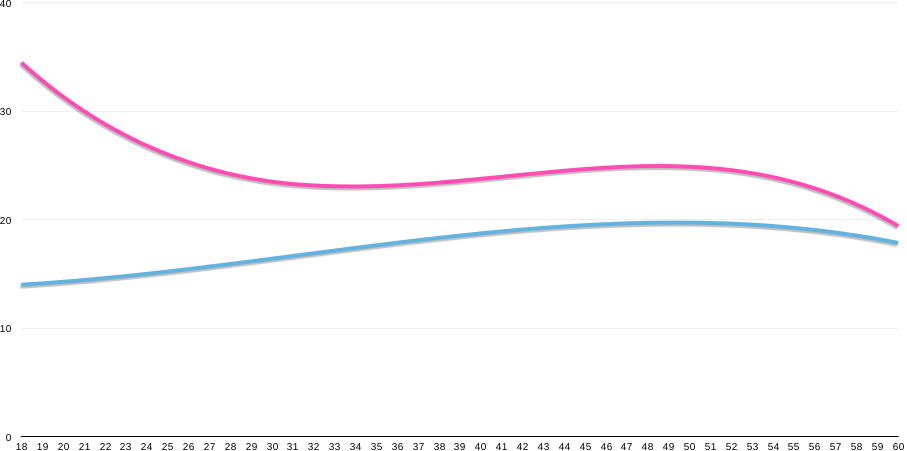
Women show more interest in friendship in the original chart, particularly among the youngest profiles. Female interest generally decreases with age, while male interest increases. The original commentary also noted that some dips in the female series occurred at similar ages to rises in the affairs series.
How to interpret it
Similar shapes in two charts do not establish a connection between the behaviours. Choosing friendship on a dating profile can describe one goal among several; it does not measure the quality or size of someone’s existing social circle.
Try Saucy Dates · Adults 18+
Discover people who share your interests
Statistics show patterns. Your next connection starts with finding someone whose interests fit yours.
Joining, browsing, Hots and flirts are free. Full private messaging requires an upgrade.
Sex toys: interest by age
This category recorded an interest in sex toys, whether alone or with a partner. It did not measure ownership, frequency of use or a particular product preference.
What the chart shows
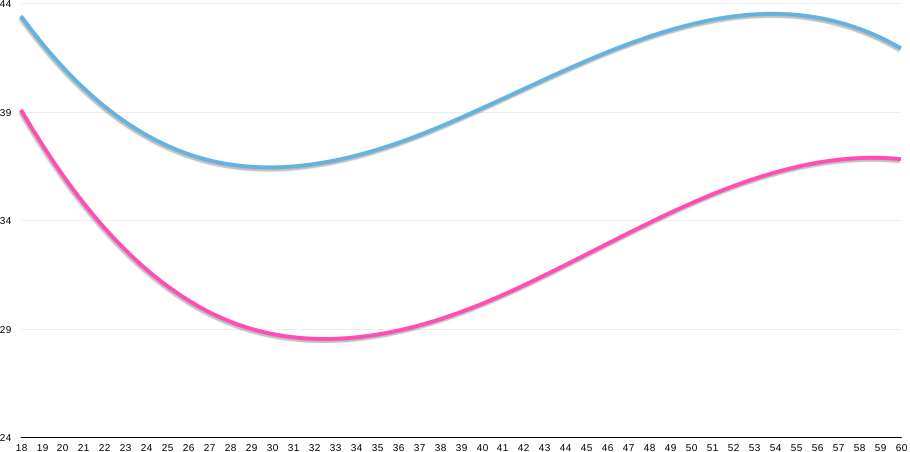
Men show higher declared interest in the published chart. Both series have a modest dip around ages 30 to 35. The original report described female interest at age 20 and age 60 as similar.
How to interpret it
A broadly similar percentage in two age groups does not mean the individuals have identical preferences. The chart is useful for comparing the reported pattern, rather than predicting what someone wants.
Dogging: interest by age
The original category referred to interest in watching or taking part in sexual activity in public or semi public settings. It recorded an interest label, not verified conduct.
What the chart shows
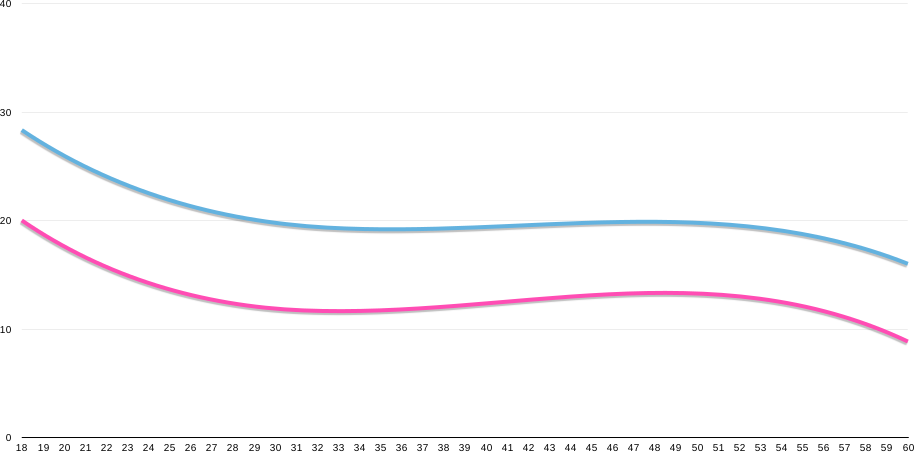
Male declared interest is higher across the age range. Interest generally declines with age in both series, with a relatively consistent difference between them.
How to interpret it
The report did not measure exposure to media or establish why younger groups selected this option more often. The label should not be read as permission to involve bystanders: an expression of interest does not establish consent from anyone else.
Anal sex: interest by age
The original report framed this category around male interest in penetrating a female partner and female interest in being penetrated. That narrow framing is part of the historical report, not a complete description of everyone’s sexual interests.
What the chart shows
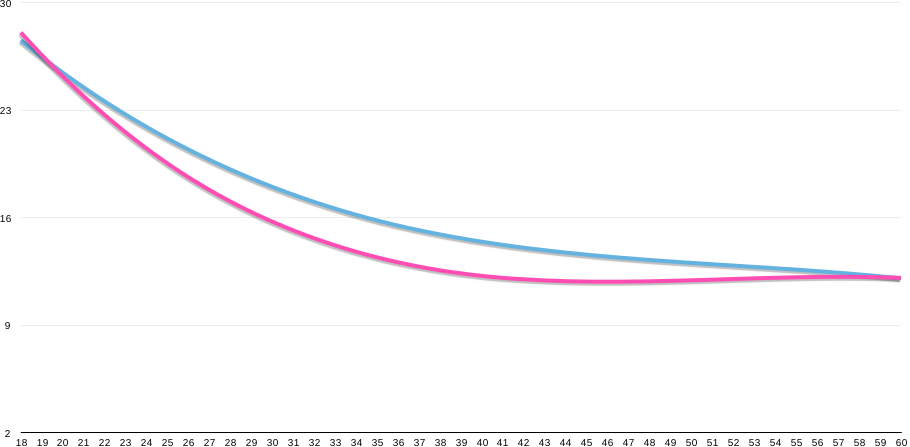
Men show marginally higher declared interest than women. Interest decreases across older age groups, with the strongest interest at ages 18 to 25. The original commentary described interest at 18 as approximately twice that at 60.
How to interpret it
That comparison is an interpretation of the chart, not a separate published table of exact values. The data does not establish whether media, pornography, experience or any other factor explains the difference.
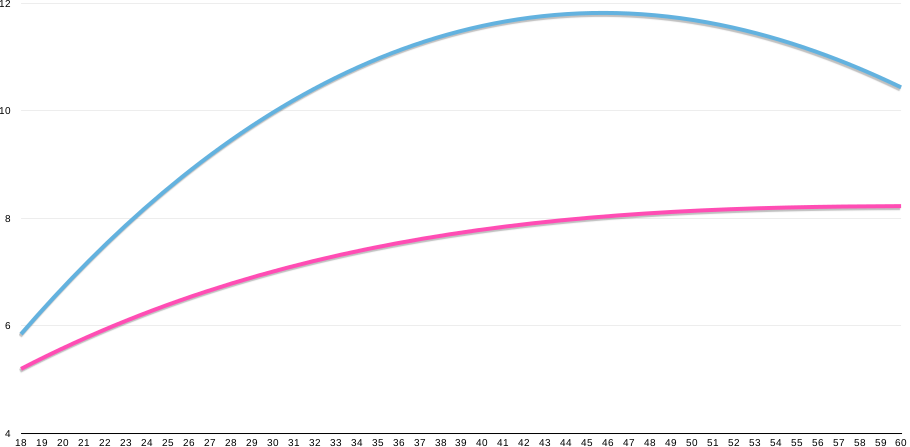
Bondage: interest by age
The category recorded interest in bondage without separating dominant and submissive preferences. No breakdown by role was included.
What the chart shows
The original chart shows higher declared interest among men. In general, both series rise across the age range.
How to interpret it
The chart does not tell us whether older respondents had more experience or whether younger respondents were less adventurous. Those explanations would require further research. A profile preference is a starting point for conversation, never consent to a particular activity.
Oral sex: interest by age
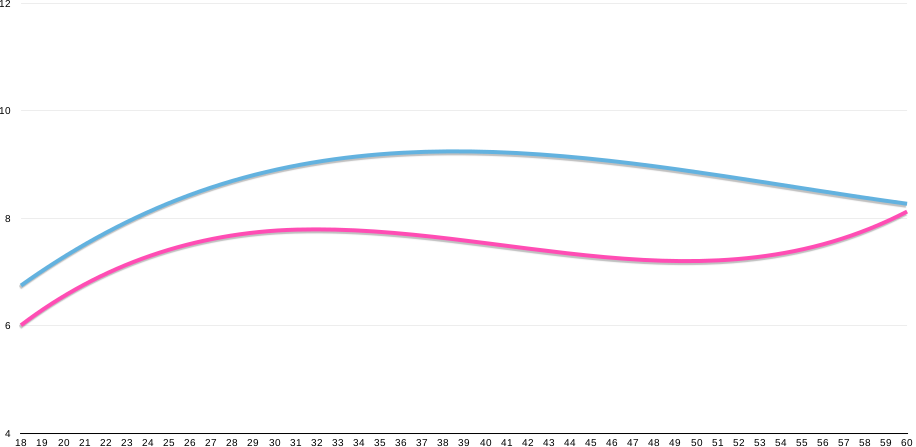
Interest included giving, receiving or both. The report did not separate those preferences.
What the chart shows
Male declared interest is marginally higher. Both series remain comparatively consistent across the age spectrum.
How to interpret it
A relatively stable pattern is different from a universal preference. The result does not mean everyone enjoys the activity or that a partner should be expected to take part.
Cybersex: interest by age
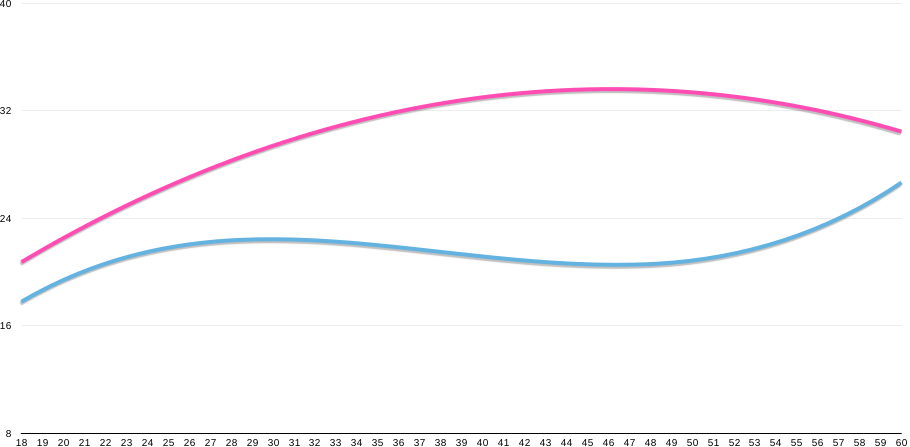
The original definition covered exchanging sexual text, pictures or video with another adult without physical contact. It did not distinguish different services or communication formats.
What the chart shows
Female interest generally exceeds male interest after about age 21, with peaks described in the mid thirties and around 60. Male interest is relatively consistent. The original report noted similarities between the female cybersex and affairs trend lines.
How to interpret it
Similar trend lines do not show that the same people selected both options, or that one causes the other. The data also does not establish that online interaction is safer. Privacy, image sharing and boundaries still matter; see our dating safety guide.
Voyeurism: interest by age
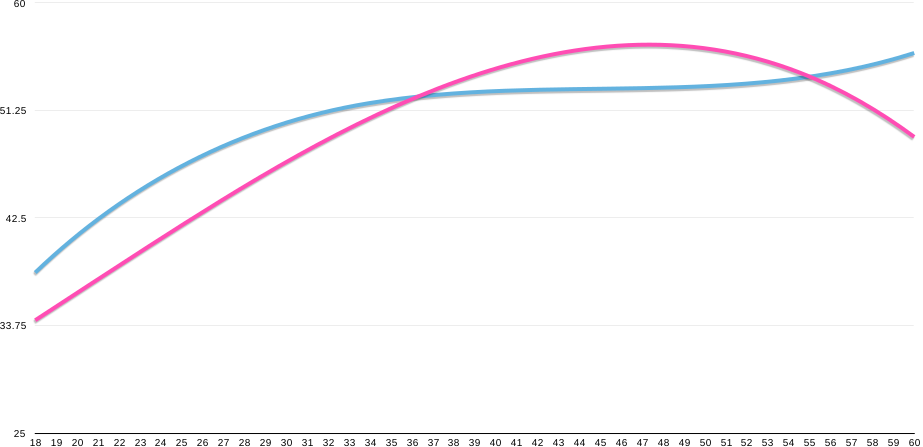
Here the category describes interest in watching sexual activity. The report did not distinguish consensual arrangements from other interpretations of the label.
What the chart shows
The two series are broadly similar and generally rise with age. The original commentary described interest at 60 as about 50% higher than at 18, and noted that female peaks occurred at similar ages to those in the exhibitionism chart.
How to interpret it
“50% higher” is a relative comparison, not an increase of 50 percentage points. It is retained as the original chart commentary rather than a newly calculated statistic. The report cannot explain the pattern through confidence or physical appearance. Any real world involvement requires everyone’s knowledge and consent.
Exhibitionism: interest by age
This category described interest in being watched during sexual activity. It did not establish that respondents had taken part or distinguish the settings they imagined.
What the chart shows
Female declared interest is higher in the original chart and generally increases with age, reaching its strongest level in the forties. Male interest is relatively consistent across the age range.
How to interpret it
The chart does not measure body confidence or explain why people selected the option. An interest in being watched does not imply willingness to involve people who have not agreed to participate.
What this report tells us about sex and relationships
The charts show that members across the adult age range expressed a variety of relationship goals and sexual interests. Some categories have broadly stable patterns; others differ more noticeably between age groups. There is no single profile of what an adult of a given age wants.
For singles, the practical value is a reminder to ask rather than assume. A person may be interested in friendship, a casual connection or a committed relationship regardless of the broad pattern in their age group. An interest listed on a profile can open a conversation, but it cannot replace a discussion about expectations and boundaries.
For researchers and writers, these charts can suggest questions for further study. They cannot explain the causes of the patterns or establish trends over time. A new study would need a defined collection period, clear questions, subgroup counts and an appropriate sampling method.
Questions about the sex and relationships report
Do sexual interests change with age?
This report shows differences between age groups in a historical sample. It does not track the same people over time, so it cannot establish how an individual’s interests change as they age.
How many people were included?
The original report describes 5,000 randomly chosen male and female member profiles. It does not publish separate sample sizes for each gender or age group.
Are these statistics representative of all adults?
No. The sample came from Saucy Dates members. People using a casual dating service and disclosing interests on their profiles may differ from the wider population.
Do the charts measure sexual activity?
No. They measure declared profile interests. They do not show whether members took part in an activity, how often they did so or their interest in any specific partner.
Are the figures current?
These are the original historical charts. The article has been refreshed, but the underlying data has not been recollected. The original article does not supply a collection date.
Can I quote or reproduce a chart?
Yes. Please credit Saucy Dates and link to this report. Keep the sample and historical context with the finding, and avoid presenting the chart as a population estimate or evidence of cause and effect.
For journalists, researchers and bloggers
You may reuse the report’s data and charts without prior permission. Please reference Saucy Dates as the source and link to this report so readers can review its methodology and limitations.
Suggested attribution: “Source: Saucy Dates sex and relationships report, based on a historical sample of 5,000 member profiles aged 18 to 60.” Identify chart comparisons as declared interests rather than observed behaviour.
For questions about the research, media assets or commissioning a new survey, contact Saucy Dates. We can discuss research ideas around dating and relationships; please get in touch about the evidence and scope your story needs.
Explore more Saucy Dates research
Interests are only one part of the picture. Compare them with our separate studies of sexual duration and expectations and reported relationship lies and cheating. These studies use different samples and do not track changes in the same people.
Cheating and forgiveness
A separate survey of 613 women explores stated responses to different relationship boundaries, with UK and US comparisons.
How far would men travel for sex?
Explore the original survey of 544 men, its travel distance figures and the limitations of the published data.
Find more articles on the Saucy Dates blog, or explore how the service works.