
Original Saucy Dates research · 3,836 people · 2017
How long does sex last? Duration, expectations and country results
Women wanted intercourse to last 25 minutes 51 seconds. Men wanted 25 minutes 43 seconds. In our survey of 3,836 people, the sexes were just eight seconds apart in their ideal duration, but reported reality fell short of those expectations.
What began as a comparison of men’s and women’s reports became one of our most widely discussed research stories, attracting international media and television attention. Here are the original findings, the bedroom performance infographic and the age and country patterns behind the headlines.
Our question was specifically about intercourse, not foreplay. The results should not be read as the length of an entire intimate encounter or a target everyone should reach.
Ideal duration · Infographic · Country figures · How we asked · Media coverage · FAQs
25 min 51 sec
Women’s average answer to how long they would like intercourse to last.
25 min 43 sec
Men’s average answer to the same question.
Eight seconds apart
Both groups wanted a remarkably similar duration. The bigger gap was between those wishes and reported experience.
How we researched how long sex lasts
We asked 3,836 people two questions:
- “The last time you had sex (intercourse, NOT foreplay), how long did it last?”
- “How long would you like sex (intercourse, NOT foreplay) to last?”
We compared male and female responses globally and by country, then looked at patterns across age groups. The original report records answers ranging from less than a minute to an hour.
This is our original 2017 survey. Answers were self reported, not independently timed, and the article does not publish country or age group sample sizes, confidence intervals or the method used to fit the trend lines. It is a snapshot of our dating network respondents, not a clinical benchmark or a representative measurement of every adult.
Men don’t exaggerate? The answers were surprisingly close
Our initial aim was to see whether men reported longer durations than women. Comparing their average answers, both globally and within countries, we found that most were within a few seconds of each other. As we said in the original story: the men were honest, or the women exaggerated just as much!
That agreement gave us confidence that the two sets of answers told a similar story. It does not independently verify the timing, because both groups were reporting from memory. The interesting result was the similarity, rather than evidence that one group was more truthful.
Global disappointment: expectation versus reality
Both groups wanted roughly 26 minutes, but the country and age trends in our infographic did not reach that ideal. Even the highest highlighted country peak, 17 minutes 5 seconds for US men aged 31, was below both groups’ desired average.
That is the gap behind our original “global disappointment” headline: on average, respondents wanted intercourse to last longer than the reported trends suggested. It does not mean every person was disappointed, or that a shorter encounter was unsatisfying. The questions measured time and desired time, not every part of satisfaction.
Bedroom performance: the original infographic
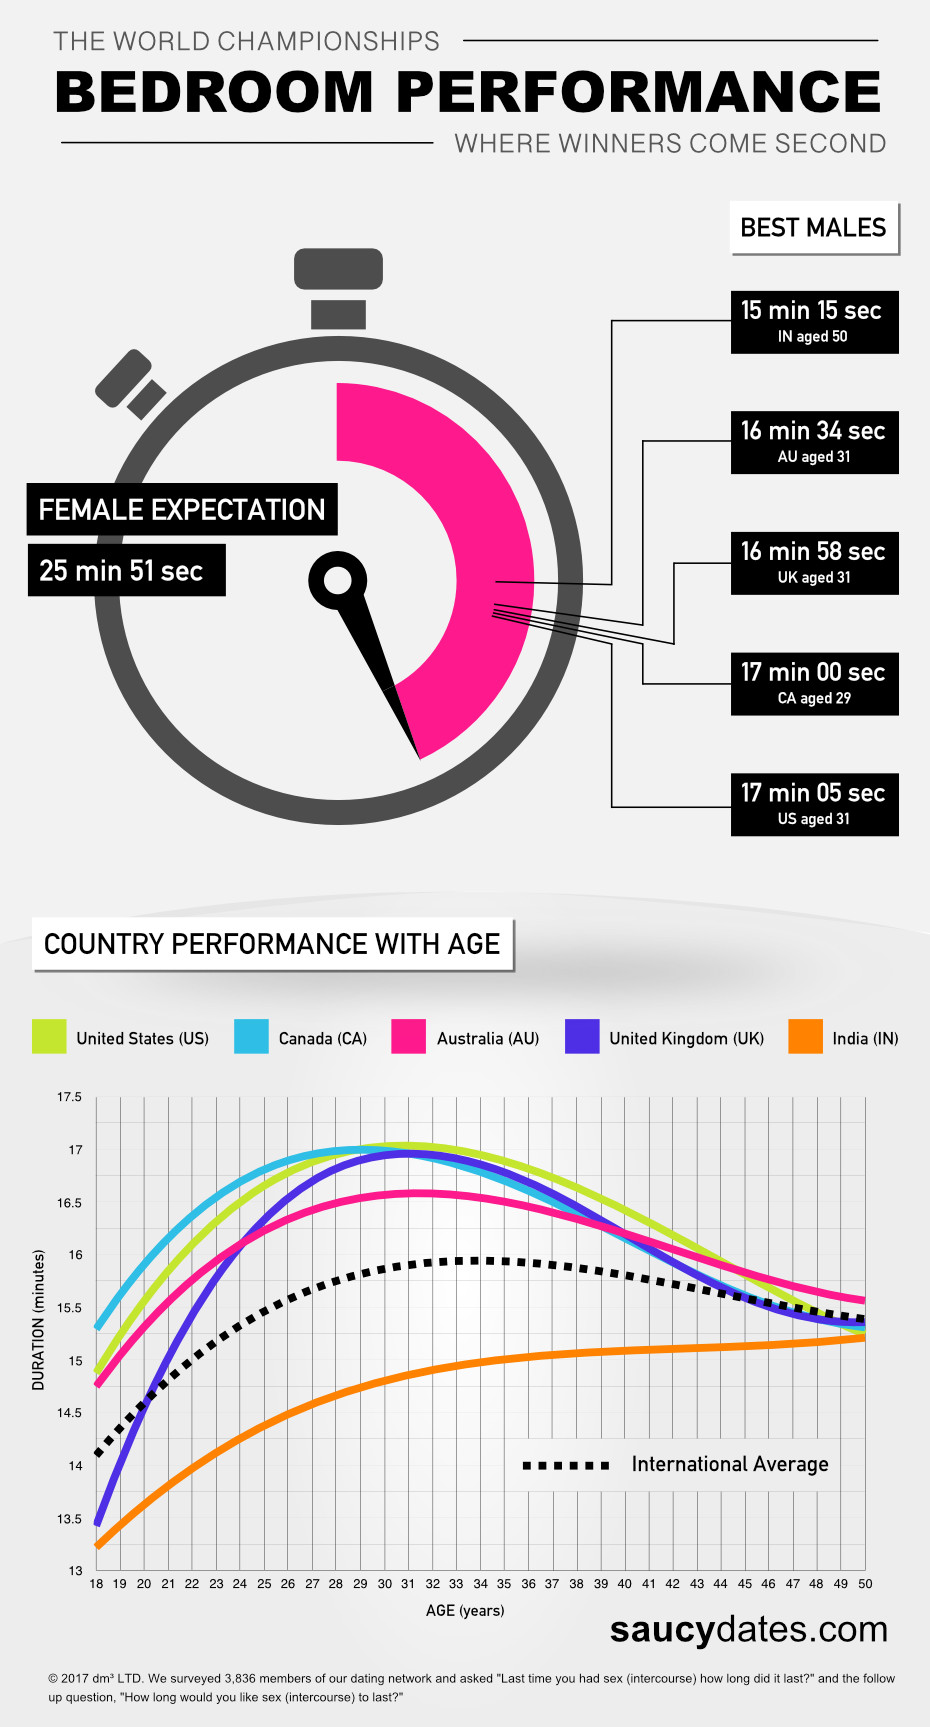
Our “World Championships: Bedroom Performance” graphic shows the desired duration, highlighted country peaks and the trend lines from ages 18 to 50. The original artwork and figures are unchanged.
Embed this infographic on your website
Copy the code to include the original graphic with a source link.
Try Saucy Dates · Adults 18+
Find someone on your wavelength
Shared attraction starts with people, not a stopwatch. Explore adults interested in casual dating.
Joining, browsing, Hots and flirts are free. Full private messaging requires an upgrade.
How long does sex last by country?
These are the peak figures highlighted in the infographic, not all age national averages. The ages identify where each country’s published trend reaches its highest point within the displayed range.
| Country | Highlighted peak duration | Age at that point |
|---|---|---|
| Australia | 16 minutes 34 seconds | 31 |
| Canada | 17 minutes 00 seconds | 29 |
| India | 15 minutes 15 seconds | 50 |
| United Kingdom | 16 minutes 58 seconds | 31 |
| United States | 17 minutes 05 seconds | 31 |
United States: strong staying power
The US trend sits above the international average across almost the entire displayed age range. Its highlighted peak is 17 minutes 5 seconds at age 31, the highest of the five shown. As a UK based company, we had to give our American respondents their moment!
Canada: ahead at younger ages
The Canadian line is close to the US line and leads the displayed countries at younger ages, before about 28. Its highlighted peak is 17 minutes at age 29, and it remains above the international average for much of the chart.
Australia: a solid performance
Australia stays above the international average across the displayed range. Its peak is 16 minutes 34 seconds at age 31. At 45 and above, its line leads the other displayed countries.
United Kingdom: improving into the thirties
The UK starts below the international line at younger ages and soon improves, reaching roughly the international level around 20. By the early thirties it is close to the highest country lines, with a highlighted peak of 16 minutes 58 seconds at 31.
India: a different age pattern
India’s line stays below the international average in the displayed range, but rises with age rather than following the same pronounced peak and decline. By 50 it is much closer to the other country lines, reaching the highlighted 15 minutes 15 seconds.
The international average
The global line includes these countries and others. The original report explains that additional countries were not shown separately because they had too little data to produce a reliable trend line.
How does intercourse duration vary with age?
Across most of the displayed country trends, reported duration rises from younger ages towards the late twenties or early thirties and then declines. India follows a different pattern, continuing to rise through the displayed range.
This was the surprise that changed the direction of our research. The story was no longer just about whether men and women gave similar answers: age revealed a pattern worth discussing too.
The chart compares people of different ages at one point in time. It does not follow the same people through their lives, so it cannot establish that a particular person will reach a peak at 31 or follow their country’s line.
Why might age and country make a difference?
Our original discussion asked whether experience, effort and differences between couples could help explain the patterns. Those remain questions for further research rather than causes established by the survey.
The questionnaire did not test anatomy, childbirth, circumcision or cultural explanations. It would therefore be misleading to use these results to claim that those factors caused the differences. What the data gives us is a set of reported patterns and a strong reason to ask more focused questions.
How long should sex last?
The survey’s answer to “How long would you like it to last?” is an expression of preference, not a rule. The 25 minute figures do not create a requirement for anyone else, and the country peaks are not targets to compete against.
Our message remains to enjoy the time together rather than turn it into a stopwatch contest. Talk about what you both enjoy and want. A number on an infographic cannot tell you what your partner finds comfortable or satisfying.
The story in international media
The survey became an international talking point. Published coverage includes the San Francisco Chronicle, Global News in Canada, Maxim and FOCUS in Germany.
This page is the original source for the survey and infographic. When reporting the findings, distinguish desired duration from reported duration, and make clear that the question excluded foreplay.
Frequently asked questions about sex duration
How long does sex last on average?
This survey reports age and country trends rather than one precise overall duration. The highlighted country peaks range from 15 minutes 15 seconds to 17 minutes 5 seconds. They are peak points on the published chart, not national averages for every age.
How long do women want sex to last?
Women in our survey gave an average preferred intercourse duration of 25 minutes 51 seconds. That is a group average, not the preference of every woman.
How long do men want sex to last?
Men’s average preferred duration was 25 minutes 43 seconds, only eight seconds below the women’s average.
Did the survey include foreplay?
No. Both questions explicitly specified intercourse, not foreplay. The results should not be described as the duration of a whole intimate encounter.
Which country had the highest peak?
The United States had the highest highlighted peak among the five displayed countries: 17 minutes 5 seconds at age 31.
Were participants timed?
No. These were self reported answers from 3,836 people in the original 2017 survey, rather than independently timed observations.
Press, research and infographic reuse
Please credit Saucy Dates and link to this article when using our findings or infographic. Include the 2017 publication date, sample of 3,836 and the distinction between actual reported duration and desired duration.
For interview requests, media enquiries or commissioning a new survey, get in touch.
More original Saucy Dates stories
For another view of expectations and reported behaviour, see our survey of relationship honesty and cheating. It asks different questions of a separate sample, so the findings should be read alongside one another rather than combined.
Explore the world’s best and worst lovers survey, our research into penis size claims and the sex and relationships report, or browse the blog.